Storage monitoring involves discovering the estate, devices, and network interconnections. Key telemetry requirements include their states, performance metrics, and logs. As the complexity of the environment increases and storage reliability improves, the focus shifts. Understanding the layers above, such as file systems and databases, and their demand for storage services becomes crucial. This article delves into the detailed knowledge required to achieve effective observability.
Introduction
When running a cloud-native application with a well-defined architecture, a sudden increase in application latency often points to the database as the culprit. At this stage, it is crucial for Site Reliability Engineers (SREs), DevOps, or Storage Engineering teams to quickly isolate the cause and collaborate with developers to resolve the issue. Often, the problem lies not with the database itself but with the underlying storage or overlying applications. Let’s explore this problem in more detail with a specific example.
Note: In this article, the term ‘application’ will refer to a ‘database.’ For example, MongoDB will be referred to as an ‘application.’
Understanding the Application
Achieving effective database observability requires a comprehensive understanding of the application. This includes knowledge of deployment modes, metric definitions, well-known logs and events, configuration details, the database’s object model, network topology, visualization dashboards, and potential alerts and issues.
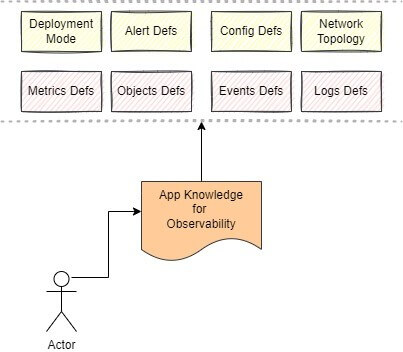
Let’s dive deeper into a few of the above points about the knowledge required for the application.
Deployment Modes and Methods
Applications can be deployed in various ways, each with its specific considerations for production and development environments. For production deployments, high availability and disaster recovery are crucial. Typically, a cluster mode is used for production to ensure these features, while a standalone mode is more common during development for simplicity and cost-effectiveness.
In cluster mode, it is essential to understand the primary and secondary node switchover process and the primary node election mechanism. Deployments can also occur in Kubernetes as containers or Virtual Machines as processes. This distinction impacts how resources are managed and scaled.
For MongoDB, deployment modes include:
- Replica Set: 1 primary and 2 secondary nodes.
- Standalone: Used primarily in development environments.
- Components: Shards, Mongos (router), and config server form the application.
Understanding these deployment methods helps diagnose issues related to high availability, fault tolerance, and scalability, which are critical for maintaining database performance and reliability.
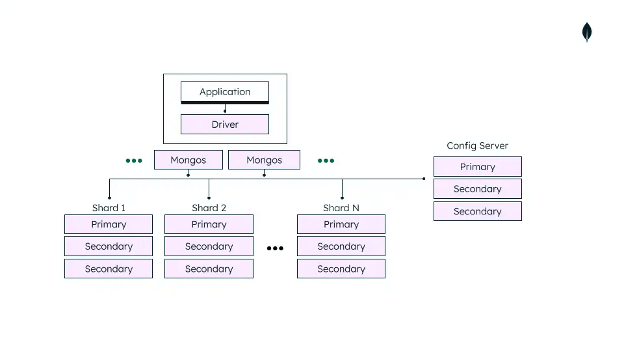
Source: MongoDB documentation
Metric Definitions
A clear understanding of application metrics is fundamental to effective observability. For example, Prometheus metrics are commonly exposed by applications for observability without additional instrumentation. Key factors to consider include:
1. Number of Metrics: Applications can expose various metrics, from tens to hundreds, each providing unique insights.
2. Categories of Metrics: These typically fall into several categories:
- Availability: Metrics like status and lock counters help track the application’s uptime and readiness.
- Performance:
-
- Throughput: Includes metrics such as active connections, number of queries and commands, and read/write rates.
- Errors: Tracks read/write operation conflicts/errors and command errors.
- Latency: Monitors query and read/write latency, which is critical for understanding user experience.
- Resource Usage: Metrics for CPU, memory, and disk usage, as well as disk read/write operations, indicate how efficiently resources are being utilized.
- Replication Health: Monitors replication status and errors, essential for data consistency and availability.
3. Levels of Metrics: Metrics can be analyzed at different levels:
- Cluster Level: Provides an overview of the entire deployment.
- Database/Single Replica/Shard Level: Offers detailed insights into specific components.
- Collection/Per Database Level: Focuses on individual collections within the database.
For MongoDB, the metric cardinality from the MongoDB exporter can exceed 5500 metrics, with unique metrics around 220. These metrics are categorized into:
- Cluster Level Metrics
- Shard Level Metrics
- Collection Stats Metrics
Dashboards are essential for consolidating these metrics and presenting a quick summary status of the running application. As described above, this requires a robust knowledge base about the application to ensure that all relevant metrics are accurately monitored and interpreted.
Network Topology
An application’s database is part of a larger cloud-native ecosystem, interacting with multiple microservices. The database itself might not always be the problem; issues can arise from various components within the network. Potential issues include:
- Infrastructure Issues: For instance, disk IOPS contention with other containers can cause higher latency for the database.
- Service-Level Problems: Queries on non-indexed fields from services directly connected to the database can lead to performance bottlenecks.
- Load Management: A higher ingress load can lead to increased active connections and queries on the database, potentially overwhelming it.
Understanding flow-based network topology is essential for diagnosing database issues. Network topology discovery tools can help visualize and trace the flow of data, identifying bottlenecks and points of failure.
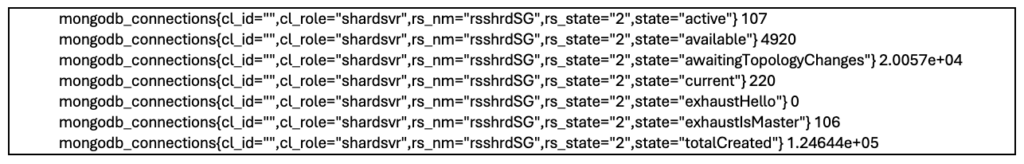
For MongoDB, monitoring the topology involves tracking connections and interactions between different components and services. This holistic view is crucial for identifying and resolving performance issues. Please visit this link for more details.
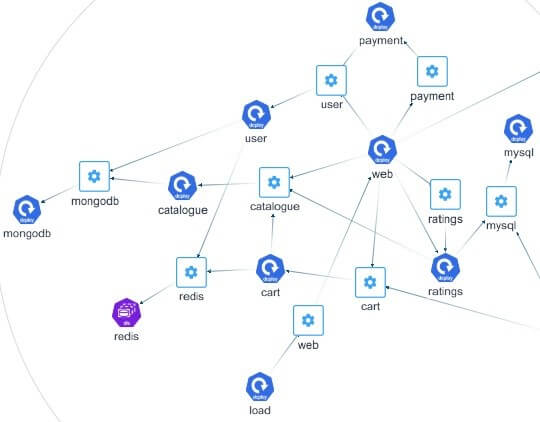
Network Topology based on Flow Data
Visualizations, Alerts, and Actionable Insights
Creating meaningful dashboards with contextual data is vital for debugging alerts and maintaining observability. Relevant metrics dashboards and alerts play an essential role in this process. Key questions to address include:
- Metrics and Events Configuration: What metrics and events need to be configured for alerts?
- Threshold Settings: What should the thresholds be?
- Automation: How can threshold creation be automated?
It’s important to set alerts based on metrics that distinguish between the cause and impact of an issue. For example, latency metric alerts highlight the impact, while read/write disk IO performance alerts highlight the cause. Both types of alerts should be related to provide a comprehensive understanding of the issue.
Example: MongoDB Alerts
Considering the necessary knowledge base, here are some example alerts for MongoDB, a NoSQL document-oriented database:
- Impact Alert: Connection build-up was observed on active connections along with global lock active client growth.
- Causal Alert: The query executor metric exceeds the regular range, suggesting issues with network topology or direct connecting client queries.
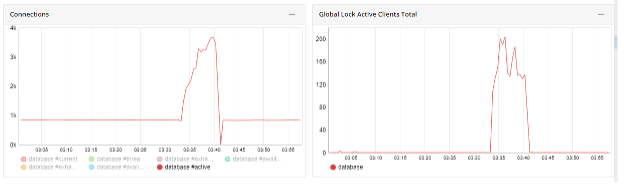
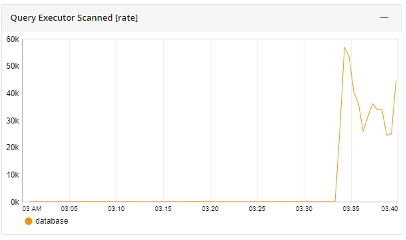
These alerts help identify the root cause of performance issues, enabling quick resolution. For instance, a latency issue might be traced back to high disk IO operations or an inefficient query pattern.
In some cases, the latency observed at the application level needs to be related to the storage infrastructure at the VM level and then at the hypervisor level, assuming the application is running in a privately managed data center. A couple of screenshots of this scenario are given below.
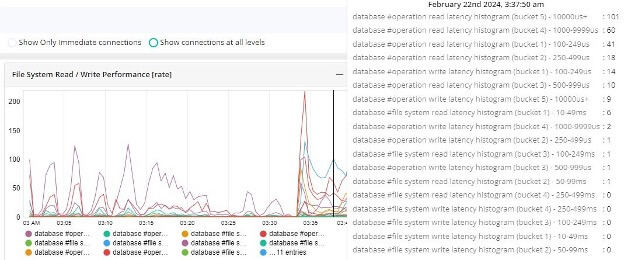
Latency observed at the Application Level
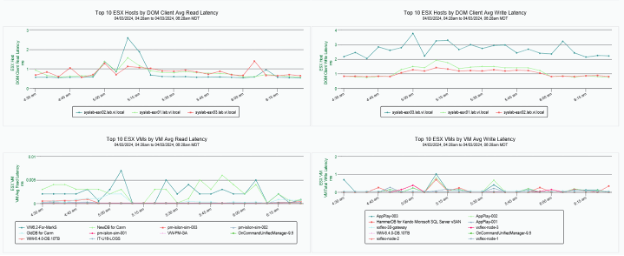
Read and write latency at the hypervisor and per VM level.
Conclusion
In summary, achieving deep application observability involves understanding the following aspects of modern cloud-native applications built with microservices architecture:
- Complete Application Discovery: Comprehensive mapping of all components and their interactions.
- Individual Service Metrics: Detailed monitoring of each service’s performance and health.
- Database Deep-Dive Knowledge: In-depth understanding of database operations, configurations, and performance metrics.
- Infrastructure Metrics: Monitoring compute and storage infrastructure to identify resource usage and potential bottlenecks.
- Automated Alerting and Actionable Insights: Setting up relevant alerts that provide immediate insights into root causes, enabling quick and effective resolution.
If you would like to learn more or have questions on how you can achieve comprehensive observability for your IT environment, give Virtana a call for a consultation. Our experts can help you implement the best practices discussed in this article, ensuring your systems are monitored effectively and issues are resolved promptly.
Author Bio:
Ramprasad Gopalsamy is an engineering leader with a passion for building quality software products right from their early-stage development. He currently leads the engineering team responsible for Application Monitoring product development at Virtana. Prior to Virtana, Ramprasad was a founding member and engineering leader of a startup company, OpsCruise, building observability for cloud-native applications. Earlier, he was a co-founder and head of engineering at Pensa Networks, building products in network functions virtualization (NFV) lifecycle management and orchestration and cloud and networking technologies.
References:
https://www.mongodb.com/docs/manual/core/sharded-cluster-components
https://github.com/percona/mongodb_exporter
https://www.mongodb.com/docs/manual/reference/command/nav-diagnostic
Ramprasad Gopalsamy