Today’s Application Infrastructure Models Are…Complex
The cloud gets all the press today, and while organizations are moving more and more of their applications and associated infrastructure into the cloud, there is still a lot of “down below” on-premises. A recent cloud computing survey from IDG shows that a clear majority of companies plan to use cloud services for over half of their infrastructure and applications. They are focusing a lot of effort and resources on building and executing an application transformation strategy, and that’s as it should be. But there’s another important point here which is often undervalued: these companies also continue to rely on on-premises deployments. The number of organizations using on-premises will go down from 91% now to 84% 18 months from now. But this means the vast majority of companies will continue to use on-premises to some degree in addition to the cloud. (A few will shun the cloud entirely but at just 5% of organizations that’s an edge case.) Hybrid cloud deployments for existing applications also continue to drive the use of on-premises resources, taking advantage of cloud scalability and cost models with front-end infrastructure, while back-end data stores remain on-premises.
Clearly, most organizations have, and will continue to have, applications and infrastructure in both worlds. But they often treat them as separate worlds. In fact, even beyond the on-premises/cloud split, the average enterprise has traditional silos for corporate IT, DevOps teams, etc. It’s understandable. Complexity is hard to manage, and these environments are highly complex, with hundreds to thousands of interrelated applications and services, multiple providers, products, and partners spanning multiple data centers and clouds, and they’re constantly evolving. And different constituents need different things. Application owners need a complete real-time view of the infrastructure servicing their applications, while infrastructure teams need to see how application workload changes are affecting (or will affect) overall infrastructure performance. All of this makes it difficult to ensure your applications, as well as the infrastructure they rely on, are available and performing as expected.
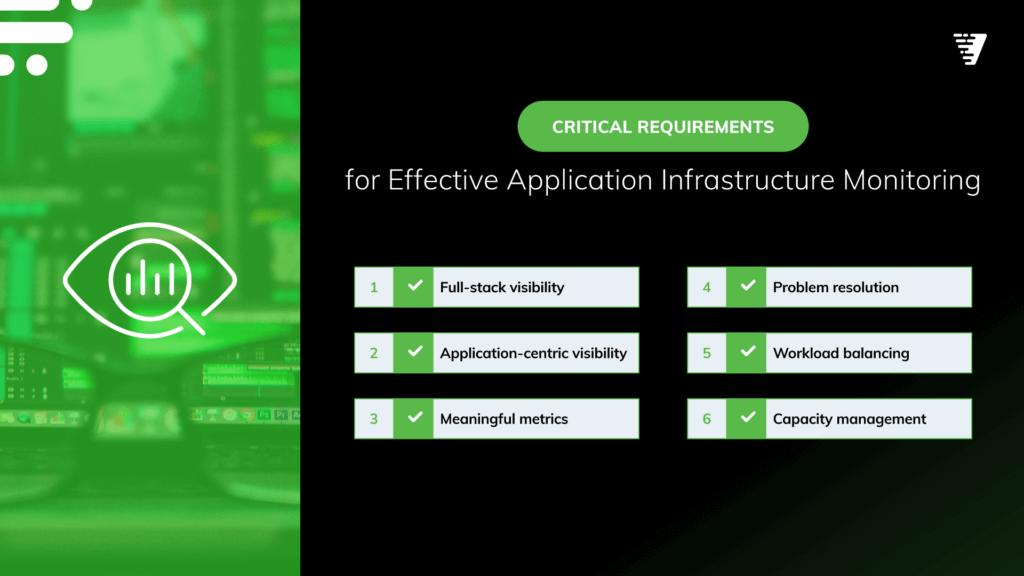
6 Application Infrastructure Monitoring Must-Haves
Detecting, diagnosing, and remedying problems in these environments requires monitoring capabilities that go well beyond simple, one-dimensional visibility. In fact, what we tend to call “monitoring” actually means a whole host of things an organization needs to be able to do:
- Capture, correlate, and analyze meaningful response-time, utilization, and health metrics in real time.
- Provide a vendor-independent, system-wide view—from client to server to network to storage—in an application context.
- Understand the relative business value or priority of the applications supported by the infrastructure.
- Use predictive analytics to prevent performance problems and outages.
- Deliver insights, such as infrastructure-stressing conditions, that are accurate and actionable.
- Scale without the risk of hitting a limit.
- Continuous discovery and updating of application infrastructure sets.
In order to do these things, there are six critical requirements to look for in a modern application infrastructure monitoring platform.

1. Full-Stack Infrastructure Visibility
Your environment relies on a wide range of servers and services—think operating systems, enterprise servers, cloud servers, storage, virtual machines, etc. Each may have its own monitoring tools, giving you visibility into that “niche” of your infrastructure. You can collect the data from those independent components, but it doesn’t give you an interrelated view across your application and infrastructure landscape. To proactively optimize the performance, availability, and efficiency of your mission-critical infrastructure, you need to be able to analyze that data as an ecosystem.
There’s long been a problem with on-premises infrastructure silos. Monitoring of storage, networks, systems and applications all happening in their own worlds without reference to each other. This often leads to slow MTTRs for resolution or problems, with endless war-rooms and fingerpointing between groups, as no single organization has a full view of the infrastructure to track down the problem. The “single-pane-of-glass” using full-stack visibility, and combined with AIOps analytics to automatically track-down root cause, and identify the solution to the problem can make these kinds of scenarios extinct.
Further, using full-stack and application-centric capacity management can prevent most problems before they have a chance to cause downtime or breach SLAs.
2. Application-Centric Visibility
Traditional infrastructure monitoring tools don’t understand your applications, and traditional application performance monitoring (APM) tools can’t diagnose infrastructure issues. This creates a problematic monitoring gap. APMs focus on behavior of the application, its code, and supporting runtime environments. But because they are largely blind beyond that—for example, they have no visibility into the storage network or storage arrays—they can’t identify any but the simplest infrastructure problems. You need to be able to see real-time performance and availability metrics correlated across the entire infrastructure from application to storage so you can quickly identify a problem and uncover the culprit.
A critical element of this is automatic application infrastructure discovery, mapping, monitoring, display, reporting, and correlation. Most mission-critical application services no longer use static infrastructure sets. The need for load-balancing, calendar-based server roles (such as the need for some SAP server roles only at quarter and year end), and other “scale-out” infrastructure all drive the need for continuous rediscovery and updates to application monitoring and infrastructure sets.
3. Meaningful Metrics
When it comes to mission-critical applications and infrastructure, how you measure is as important as what you measure. Data must be real time—that’s non-negotiable. But there are some additional requirements to look for. Granularity is important. You want to be able to monitor data flows across every component—server, switch, storage array, etc.—within the context of the applications they serve. Many monitoring solutions use metrics that are averaged over seconds, minutes or even hours – and then retain the information only for short periods of time. But in modern dynamic application environments, typically running within shared infrastructure as well, using averaging makes it difficult to diagnose problems—you need to retain not only the peaks, but the detailed data, for extended periods of time, as well as the inter-relationships of application infrastructure elements and shared infrastructure usage. Only with full views of long-term data can you also analyze and plan for seasonal trends and behavior.
4. Problem Resolution
Getting visibility is only the first step. It’s simply the means to enable you to quickly pinpoint bottlenecks, wherever they occur, and resolve the problem. To streamline this process—so you can minimize or even avoid slowdowns and outages—you need your monitoring solution to alert you in real time and provide the relevant information across the application-to-infrastructure topology you need to contextualize the problem. Advanced analytics are key to guiding your investigation into probable root cause with topology-aware correlation. The best solutions will also automatically identify the remediation needed, so that it can be pushed to your ITSM or change management system to comply with your internal risk and change management policies and tracking.
5. Workload Balancing
It’s important to identify problems as they occur and then quickly fix them, but it’s even better to keep your workloads balanced to prevent performance issues in the first place. A modern monitoring solution includes AI, machine learning and statistics-based recommendation engines that span your environment from compute to storage and take the structure and location of your applications into account. A right-sizing process, automatically or periodically run, can identify and correct workload imbalances before they strain resources and affect performance. Results should include recommendations to reclaim capacity or increase allocation to under-provisioned application elements, and full application workload stacks. And should integrated with your change management and governance processes, to track the execution and impact of changes.
6. Capacity Management
Your monitoring solution shouldn’t just focus on what’s happening right now, it should also provide capacity insight to help you keep your application infrastructure aligned with business needs—and eliminate the risk and expense that results from poor capacity planning. This means you need to track utilization across the entire infrastructure stack and track capacity trends at scale. By combining your health and performance data with capacity information and alerts, you’ll understand your resourcing trends and capacity needs throughout your environment.
Virtana: Your Application Infrastructure Monitoring Partner
With Virtana Infrastructure Performance Management, you can effectively monitor your application infrastructure to assure the performance and availability of your mission-critical workloads. Request a trial.

James Bettencourt


