Customers from around the world rely on our platform to better understand their AWS bill and save thousands each month. For some, it’s the only tool they need.
We understand that part of cost saving also means enabling you to reduce the number of expensive, niche tools in your kit. That’s why Virtana Cloud Cost Management continues to expand its features: to better serve the needs of all our customers. And we’re happy to say, our newest report comes directly from your feedback.
The AWS Services Cost Report
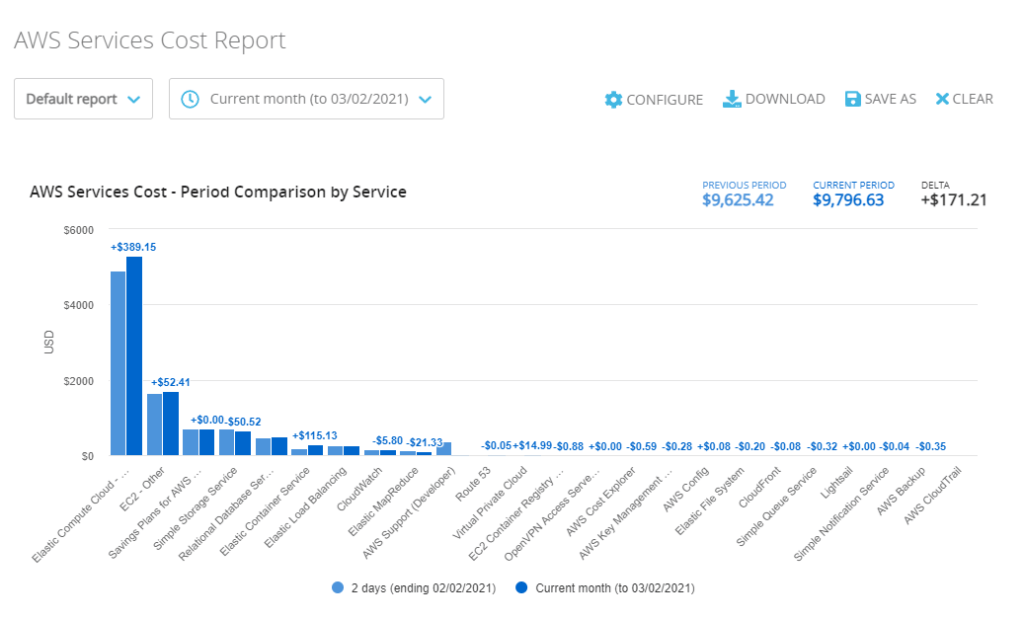
With this report you can compare costs over time, grouped by tag or attribute. This enables you to detect changes before the end of a billing period, meaning you’ll be aware of any jumps in spending and have time to reverse them before they start to add up.
Understanding the Report
In the chart below, each pair of bars represents the value associated with a given cost allocation tag key. Each pair could also represent an attribute, such as an Account ID or region.
- Dark Blue: Represents a recent period, such as: last day, last 7 days, last Wednesday, or month-to-date.
- Light Blue: Represents the preceding corresponding period (for example, the 7 days prior to the last 7 days).
This report shows you the change by tag value, over time, in both visual and tabular format.

How It’s Useful
Catches Mistakes
Increase in costs can be due to simple mistakes, such as selecting the wrong instance size or launching instance types without a corresponding reservation contract. In those cases, time is of the essence to catch the problem early and reverse it before having a bigger surprise at the end of the month.
Provides Transparency
Often, this kind of report is simply required by organizations for purposes of periodic management reporting. The AWS Services Cost report provides more insight to hosting costs (by department, application, account ID, or region) managers need for governance and planning. Having this report available and with dashboards out-of-the-box makes meeting your compliance needs a breeze.
What Else Can It Do?
Save, Email, Share
You can save an AWS Services Cost report after you have applied filtering, viewing, and grouping settings. After doing so, you can also receive them as an email immediately or on a regular basis. That way, you always have what you need at your fingertips, without having to log into Virtana Cloud Cost Management to see it. Saving and emailing this report follows the same method offered in our EC2 Recommendations report.
Emails are a great way to quickly forward important reports to stakeholders.
View From Every Angle
This report offers many ways to view your overall cost data. You can group by AWS service, by day, week, month, tag, or attribute. A day view is shown below as example.
Export to CSV
Save results in CSV format by clicking Download beneath the report.
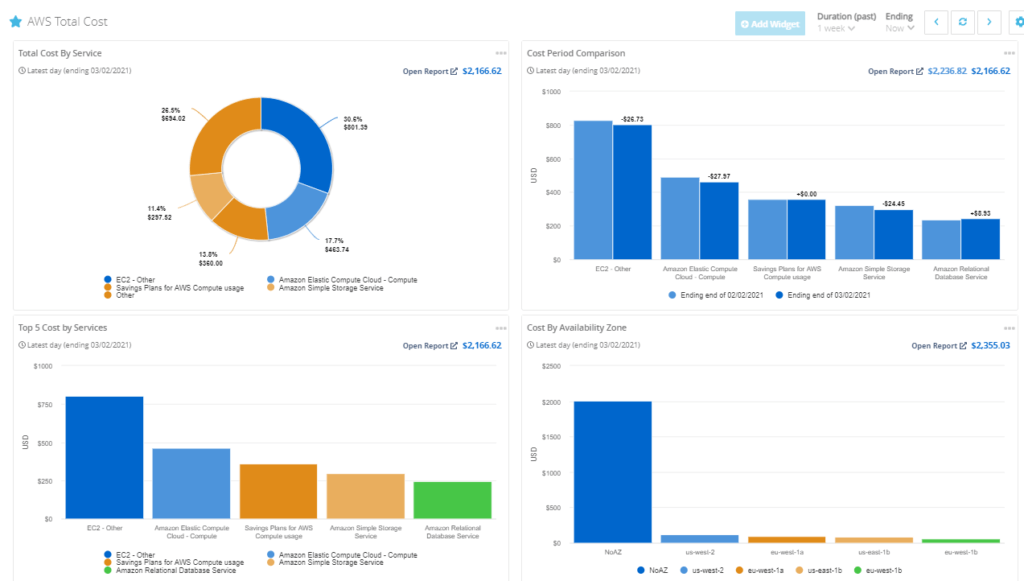
Use Prebuilt Dashboards
Dashboards are a great way to visualize multiple angles of your data. To access the AWS Total Cost Dashboard:
- Navigate to Dashboards.
- Input
AWS Total Costin the Name contains search bar. - Click on the dashboard name to open it.

Finding the Report
To find the AWS Services Cost report, follow this menu tree:
Cost Management > Bill Analysis > AWS Bill Analysis
Remember, for your tags to show up in your billing data, you must activate a regular tag to become a cost allocation tags inside your AWS console. Do this by following the instructions provided by AWS.
We hope you enjoy our new report and eagerly await feedback to continue improving our cost tools.

James Bettencourt


