Managing containerized workloads and Windows environments requires more than just basic monitoring—it demands deep observability to prevent performance bottlenecks, optimize costs, and accelerate troubleshooting. Virtana’s latest Container Observability enhancements provide IT teams with greater control, visibility, and analytics across Kubernetes and Windows-based workloads.
In this technical deep dive, we’ll explore:
- Kubernetes Resource Explorer – Gain pod-level visibility to optimize resource allocation and prevent cloud waste.
- Splunk Log Integration – Correlate infrastructure metrics with log data for faster root cause analysis.
- Enhanced Windows Support – Extend observability to Windows Server VMs, applications, and services.
Let’s take a closer look at how these capabilities help eliminate blind spots, improve efficiency, and strengthen hybrid IT operations.
Interested in learning more about other new innovative features we just announced? Follow these links to our dedicated blogs for Virtana Global View and Infrastructure Observability! For an overview of all the announcements we made today, please visit our main blog here.
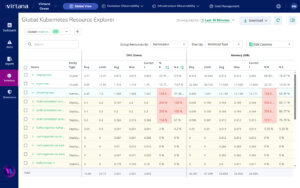
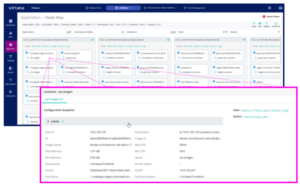
Kubernetes Resource Explorer
Managing Kubernetes workloads efficiently requires real-time visibility into resource utilization, bottlenecks, and inefficiencies. Virtana’s new Kubernetes Resource Explorer provides a granular view of CPU, memory, and storage usage across pods, nodes, and namespaces, helping you optimize performance and reduce cloud waste.
Key Benefits
- Pod-Level Visibility – Get detailed insights into resource consumption per pod, node, and namespace.
- Identify & Eliminate Waste – Detect underutilized resources, over-provisioning, and performance bottlenecks.
- Optimize Workloads & Costs – Verify right-sized deployments to avoid unnecessary cloud spend.
How to Get Started
- Enable Kubernetes Monitoring – Connect Virtana to your Kubernetes clusters (EKS, AKS, GKE, OpenShift, etc.).
- Navigate to Kubernetes Resource Explorer – Access detailed resource breakdowns at the pod, node, and namespace levels.
Splunk Log Integration
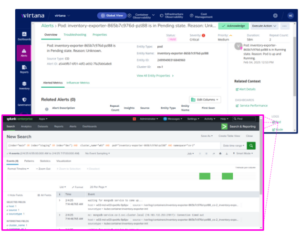
Logs are critical for understanding system behavior, troubleshooting issues, and detecting anomalies. With Virtana’s new Splunk Log Integration, you can correlate infrastructure performance metrics with log data in Splunk to gain a holistic view of your hybrid environment.
Key Capabilities
- Log & Metric Correlation – Easily match performance trends with log events to pinpoint issues faster.
- Faster Root Cause Analysis (RCA) – Reduce troubleshooting time by linking logs with real-time infrastructure metrics.
- More Ways to Access – You can configure to cross-launch into Splunk UI directly or access the Splunk logs in the following ways:
- Viewing the logs via Entities (node, deployment, pod, container, etc).
- Viewing the logs via Alerts.
- Using Data Explorer –> Logs
Setup Steps
- Splunk integration is configured via the Helm chart in your north helm value.yaml file.
- In Splunk, create a Role, User, and Auth with appropriate permissions to send data to Virtana
- Example configuration fields:
- log_source: splunksplunk_external_url:
splunk_custom_headers:
splunk_params: splunk_label_configs:
cluster_name:”cluster_name”
pod: “pod”
namespace: “namespace”
node: “node”
container_name: “container_name”
splunk_index:
qa3 :
– main
– data
qa2 :
– main
– data2
splunk_auth_token:” “
splunk_enable_ssl_context: “false”
- log_source: splunksplunk_external_url:
- Contact your Customer Support Representative or Virtana Platform Support for assistance configuring.
Enhanced Windows Support
Windows-based workloads are a critical component of many enterprise IT environments. Virtana’s Enhanced Windows Support extends observability to Windows Server VMs, applications, and services, enabling deeper performance insights, better troubleshooting, and proactive issue detection.
What’s New?
- Expanded Windows Performance Monitoring – Track CPU, memory, disk, and network utilization in Windows environments.
- Service-Level Observability – Monitor critical Windows services to detect failures or resource contention.
- Proactive Alerts & Anomaly Detection – Identify performance degradation before it impacts users.
- Log & Event Integration – Correlate Windows event logs with infrastructure metrics for better diagnostics.
How to Get Started
- Windows Servers support leverages the Alloy collector.
- Customers must install Alloy Collector on their hosts and use the configuration files to point to their Virtana Container Observability instance.
- Contact your Customer Support Representative or Virtana Platform Support for assistance configuring.
As IT environments become increasingly complex, organizations need a unified observability strategy to manage both containerized and traditional workloads. With Virtana’s latest updates, IT teams can:
✅ Optimize Kubernetes performance with pod-level insights.
✅ Accelerate troubleshooting by correlating logs with real-time infrastructure metrics.
✅ Gain deeper Windows observability for proactive issue detection and performance tuning.
✅ Optimize Kubernetes performance with pod-level insights.
By delivering end-to-end visibility across hybrid IT environments, Virtana helps organizations reduce costs, enhance performance, and drive operational efficiency. Ready to see these features in action? Explore our documentation, watch our demos, or reach out to our team today! And don’t forget to check out our dedicated blogs for Virtana Global View and Infrastructure Observability to learn more about other new innovative features we just announced!

David McNerney
Director of Product Management for Container Observability