Modern IT environments are complex, spanning on-premises, cloud, and hybrid infrastructures. Without deep observability at every layer, performance bottlenecks, inefficiencies, and troubleshooting challenges can drain resources and impact business outcomes.
Virtana’s latest Infrastructure Observability enhancements are designed to eliminate blind spots, automate performance tuning, and simplify IT operations. These updates provide:
- Nutanix AHV Integration – Full visibility into AHV clusters, hosts, and VMs for better resource management.
- Workload Right Sizer – AI-driven recommendations to optimize VM and cloud resources.
- Cisco Intersight Support – Deeper insights into UCS servers, UCSX, and Cisco-driven environments.
- Hitachi NAS & HCP Integration – Real-time analytics for enterprise storage performance.
- Enhanced iSCSI Observability – Comprehensive topology mapping and performance tracking.
- Action Service Framework – Automated incident remediation and IT workflow orchestration.
- API Support for Grafana & OpenTelemetry – Seamless data export for custom analytics.
These capabilities empower IT teams to optimize performance, reduce operational complexity, and proactively manage infrastructure across hybrid environments. Let’s explore how Virtana is taking observability to the next level.
Interested in learning more about other new innovative features we just announced? Follow these links to our dedicated blogs for Virtana Global View and Container Observability! For an overview of all the announcements we made today, please visit our main blog here.
Unlocking Deeper Observability for Nutanix AHV with Virtana
Managing Nutanix AHV clusters, hosts, and VMs just got easier with Virtana’s latest integration! Our new AHV support via Prism Element delivers deeper visibility into virtualized workloads, allowing IT teams to optimize performance, track resource utilization, and troubleshoot faster.
What’s New?
- Cluster-Wide Visibility – Get a single-pane-of-glass view across your Nutanix AHV infrastructure.
- Resource Optimization – Monitor CPU, memory, and storage usage in real-time.
- Automated Capacity Planning – Predict future resource needs based on workload patterns.
- Seamless Alerts & Reporting – Integrate alerts into your existing monitoring workflows.
How to Get Started
- Connect Virtana to Nutanix Prism Element via API.
- Configure custom dashboards to track key AHV metrics.
- Set up automated alerts for capacity thresholds and performance anomalies.

Optimize Performance & Costs with the Workload Right Sizer
Struggling with over-provisioned or underutilized resources in your hybrid environment? The enhanced Workload Right Sizer from Virtana analyzes historical data to recommend optimal resource allocation, eliminating inefficiencies while improving performance.
Key Benefits
- Automated Sizing Recommendations – Right-size VM workloads based on real-world usage.
- Cost Savings – Identify wasted resources and reduce infrastructure costs.
- Proactive Performance Management – Prevent bottlenecks by adjusting capacity before demand spikes.
- Multi-Cloud & On-Prem Support – Works across AWS, Azure, VMware, and on-premises environments.
How It Works
- Analyzes CPU, memory, disk, and network utilization over time.
- Identifies idle, oversized, or stressed workloads.
- Provides actionable recommendations for rightsizing instances and VMs.
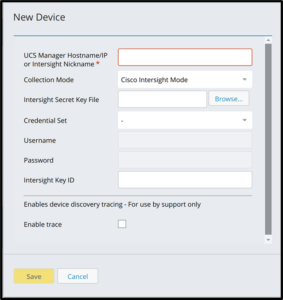
Enhanced Cisco Intersight Observability
Virtana now integrates with Cisco Intersight, giving IT teams deep insights into UCS servers, UCSX, and application workloads. This means better visibility, smarter capacity planning, and faster troubleshooting across Cisco-powered environments.
Key Capabilities
- Full-Stack UCS and UCSX Monitoring – View compute, storage, and network metrics in one place.
- AI-Powered Root Cause Analysis – Rapidly diagnose performance issues.
- Capacity Planning & Forecasting – Optimize resource allocation before demand spikes.
- Seamless Multi-Cloud Integration – Extend Cisco Intersight data across hybrid and multi-cloud architectures.
How to Enable
- Connect Virtana to Cisco Intersight via API authentication.
- Configure custom performance dashboards for UCS & UCSX.
- Set alert thresholds for CPU, memory, and storage utilization.
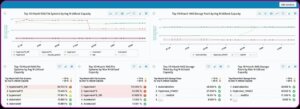
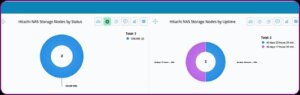
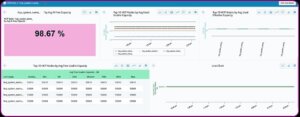
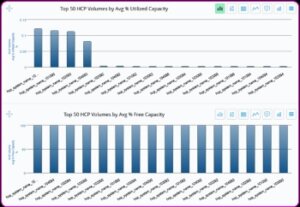
Unlocking Advanced Storage Insights for Hitachi NAS & HCP
Virtana’s latest update brings native support for Hitachi NAS & Hitachi Content Platform (HCP), providing enterprise storage teams with real-time performance insights, capacity forecasting, and intelligent alerting.
What’s Included?
- Real-Time Storage Analytics – Monitor latency, IOPS, and throughput for NAS & HCP.
- Predictive Capacity Management – Avoid storage bottlenecks before they impact performance.
- Multi-Vendor Storage Integration – Gain unified visibility across all storage platforms.
Setup Steps
- Enable Hitachi NAS & HCP connectors in the Virtana dashboard.
- Configure threshold-based alerts for proactive issue resolution.
- Access historical trends to optimize capacity planning.
Complete iSCSI Observability: Topology Mapping & Performance Metrics
Managing iSCSI storage can be challenging without full visibility into paths, performance, and dependencies. Virtana’s enhanced iSCSI topology and metrics support gives IT teams the tools to diagnose, optimize, and manage iSCSI environments with confidence.
Key Benefits
- Real-Time iSCSI Path Mapping – Visualize initiators, targets, and fabric connections.
- End-to-End Performance Metrics – Track latency, IOPS, and bandwidth across storage paths.
- Faster Troubleshooting – Identify and resolve bottlenecks with AI-driven insights.
Setup Steps
- Enable iSCSI Monitoring – Navigate to the Virtana dashboard and activate iSCSI topology mapping.
- Auto-Discover Paths & Dependencies – The system will automatically detect initiators, targets, and associated paths.
- Customize Alerts & Dashboards – Set custom thresholds for latency, throughput, and IOPS monitoring.
- Analyze Trends & Take Action – Use historical data to identify patterns and optimize storage performance.
Automate IT Operations with Virtana’s Action Service Framework
Virtana’s new Action Service Framework lets IT teams automate incident response, orchestrate workflows, and integrate with collaboration tools like Slack & Microsoft Teams.
What It Enables
- Automated Incident Remediation – Trigger actions when anomalies are detected.
- Integration with ITSM & Collaboration Tools – Connect with Slack, Microsoft Teams, WebEx Teams, ServiceNow, etc.
- Custom Workflow Automation – Define playbooks for repeatable incident handling.
How It Works
- Event-Driven Actions – Configure triggers based on alerts, performance anomalies, or capacity thresholds.
- Automated Playbooks – Define workflows that execute predefined actions (e.g., restart services, escalate tickets).
- Seamless Integration – Connect directly to ITSM tools, messaging platforms, and automation frameworks.
How to Get Started
- Enable the Action Service Framework – Navigate to Settings > Select Integrations > Select Action Integrations > Add and configure the integration.
- Define Event Triggers in IO – Select key events (e.g., latency spikes, capacity limits) that should trigger actions.
- Set Up Response Actions – Assign automated actions such as alert notifications, service restarts, or ticket creation.
- Test & Optimize – Run simulations to verify workflows trigger the correct responses.
New API Support: Export Observability Data to Grafana & OpenTelemetry
Virtana now supports API-based data exports to Grafana & OpenTelemetry, allowing teams to visualize and analyze performance metrics within their preferred monitoring stacks.
What This Means for You
- Flexible Data Export – Send performance insights to Grafana dashboards & OpenTelemetry pipelines.
- Unified Monitoring – Combine Virtana data with other observability sources.
- Custom Analytics – Build tailored queries to extract the most relevant insights.
How to Get Started
- Enable API Access – Obtain your Virtana API key from the platform’s developer settings.
- Configure Data Export – Set up an API pipeline to send performance metrics to Grafana or OpenTelemetry.
- Define Custom Queries – Use Grafana Query Language (GQL) or OpenTelemetry data models to format insights.
- Build & Customize Dashboards – Create real-time visualizations of key performance indicators.
Hybrid IT environments demand real-time insights and intelligent automation to avoid performance issues, capacity constraints, and cost inefficiencies. With Virtana’s latest Infrastructure Observability updates, IT teams can:
✅ Gain deeper insights into Nutanix, Cisco, Hitachi, and iSCSI storage.
✅ Optimize workloads and resource allocation with AI-driven recommendations.
✅ Automate incident response with the Action Service Framework.
✅ Unify observability data through Grafana and OpenTelemetry integrations.
By optimizing every layer—from compute and storage to networking and automation—Virtana enables organizations to have the visibility, intelligence, and control needed to drive efficiency and innovation.
Ready to see these capabilities in action? Explore our documentation, watch our demos, or reach out to our team today! And don’t forget to check out our dedicated blogs for Virtana Global View and Container Observability to learn more about other new innovative features we just announced!
Marc Bachmeier
Sr. Product Manager, Virtana