Unlock the Full Potential of Your AI Data Fabric with Virtana Platform
Simplify Complexity, Optimize Performance, and Power Your AI Workloads with Confidence

95% Reduce MTTR
End-to-end view of what’s connected to your fabric, where it is, and the paths they take across your fabric, and the conditions that are impacting whatever is running on the fabric.

30% improved resource utilization
Optimize resources and gain significant cost savings on infrastructure and better performance without unnecessary over-provisioning.

40% increased operational efficiency
Allow your IT staff to focus on higher-value tasks and strategic initiatives rather than reactive troubleshooting.
Comprehensive Visibility and Control for AI Data Fabrics
Virtana Platform simplifies the complexity of managing AI Data Fabric environments by delivering unparalleled observability across your entire infrastructure. From GPU clusters and interconnected fabrics to storage arrays, Virtana enables you to see every component of your AI environment in real-time, providing actionable insights to:
- Visualize connections across GPU clusters and storage with dynamic topology mapping.
- Proactively monitor performance, capacity, and health to prevent disruptions.
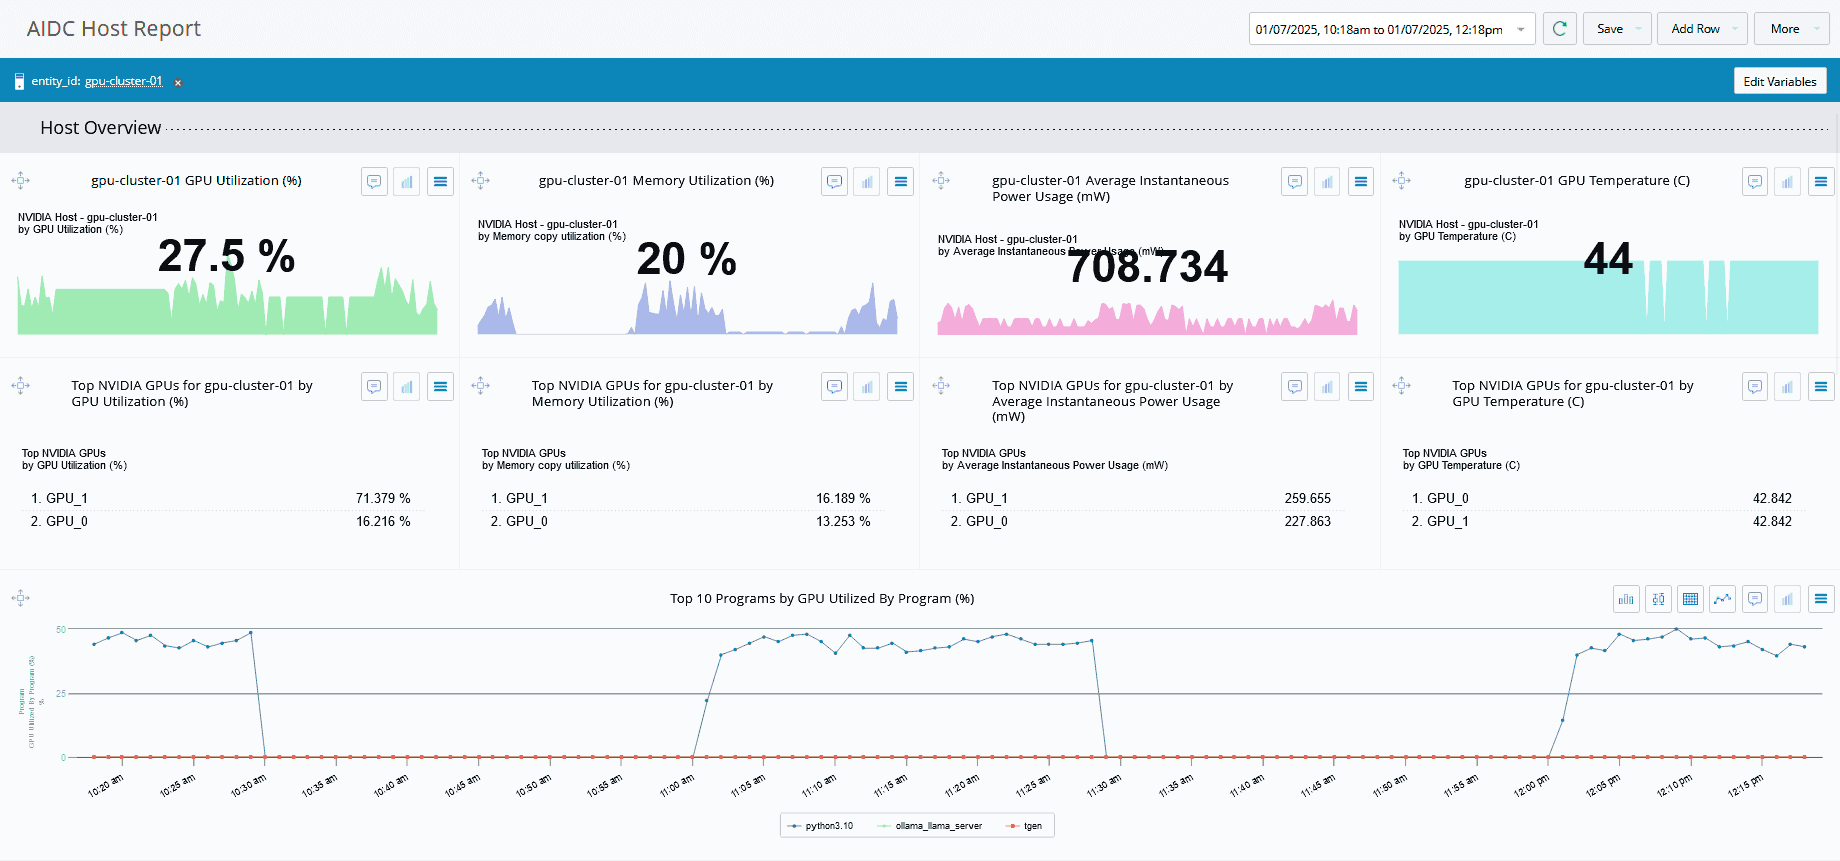
- Track workload performance and optimize resource allocation for maximum efficiency.
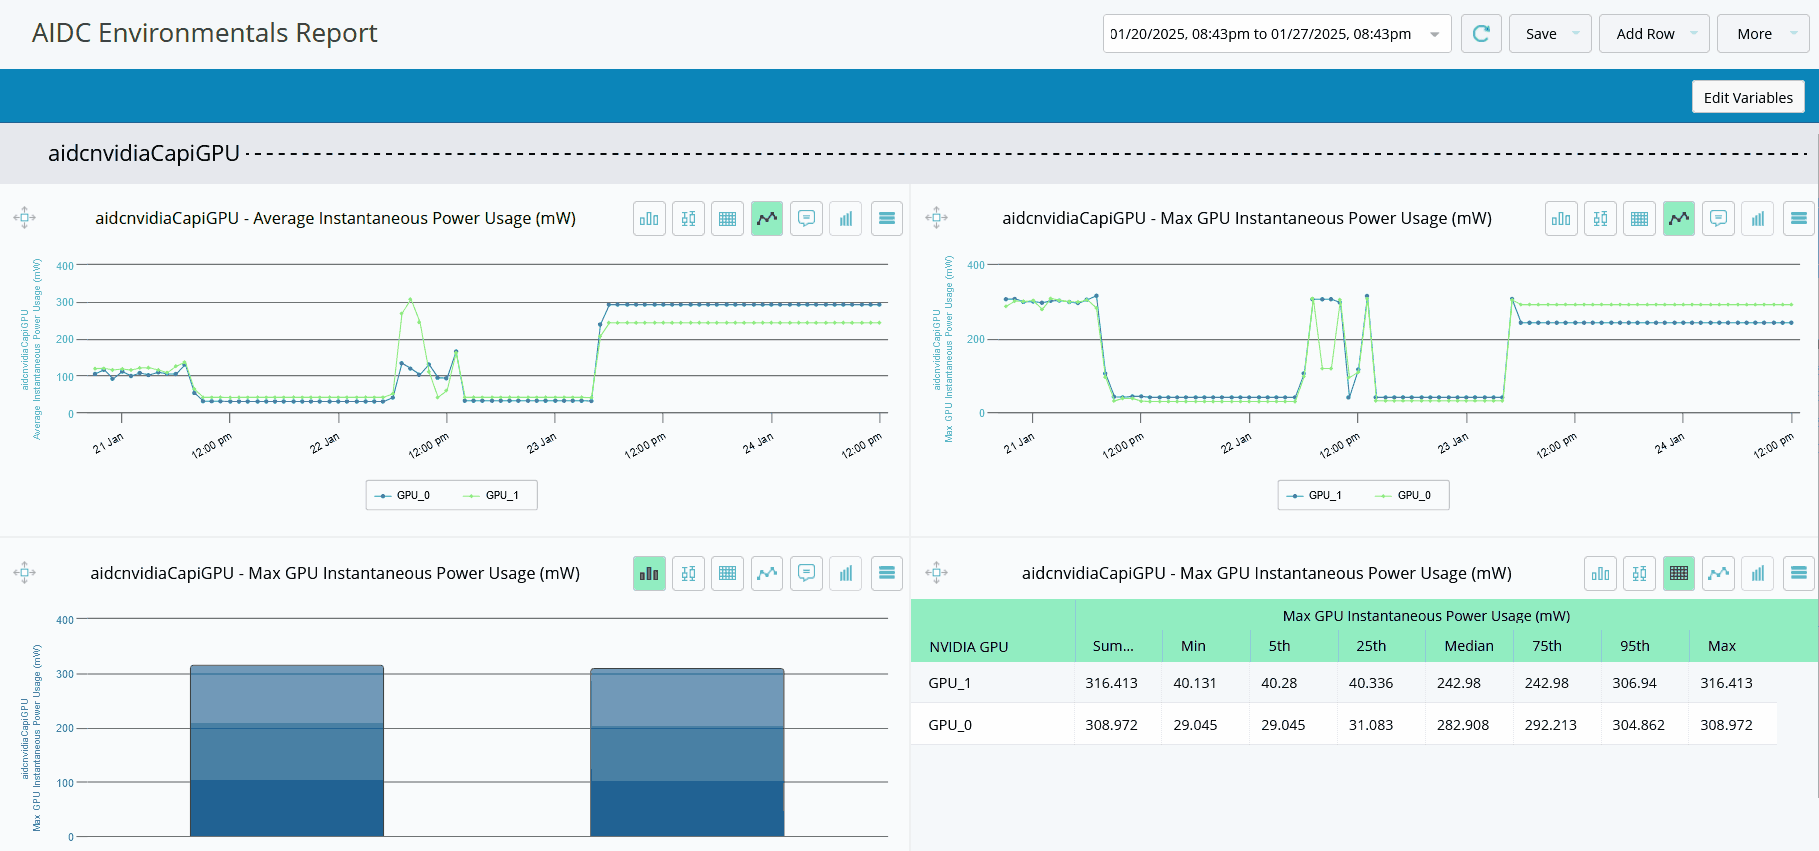
- Plan for growth by analyzing power and cooling requirements for GPU clusters.
With Virtana, you gain the tools to reduce operational complexity, improve decision-making, and keep your AI infrastructure running at peak performance.
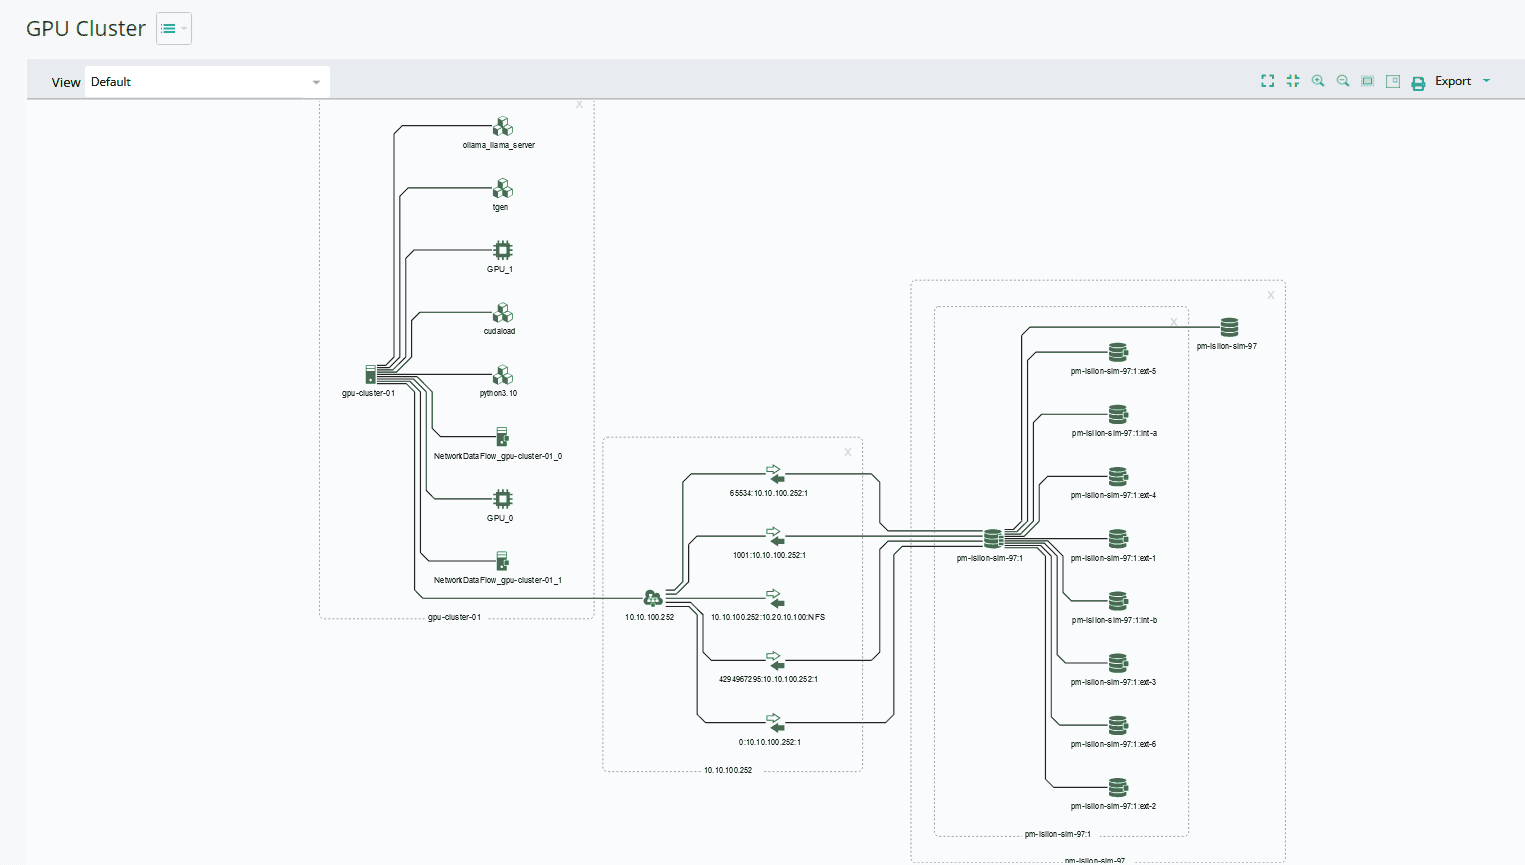
Real-Time Topology Mapping
Automatically discover and visualize your AI Data Fabric, focusing on interconnected GPUs, fabrics, and storage. Quickly identify issues and resolve them with precision.
- Automated connectivity mapping for faster issue resolution.
- Simplified troubleshooting with filtered views of selected devices.
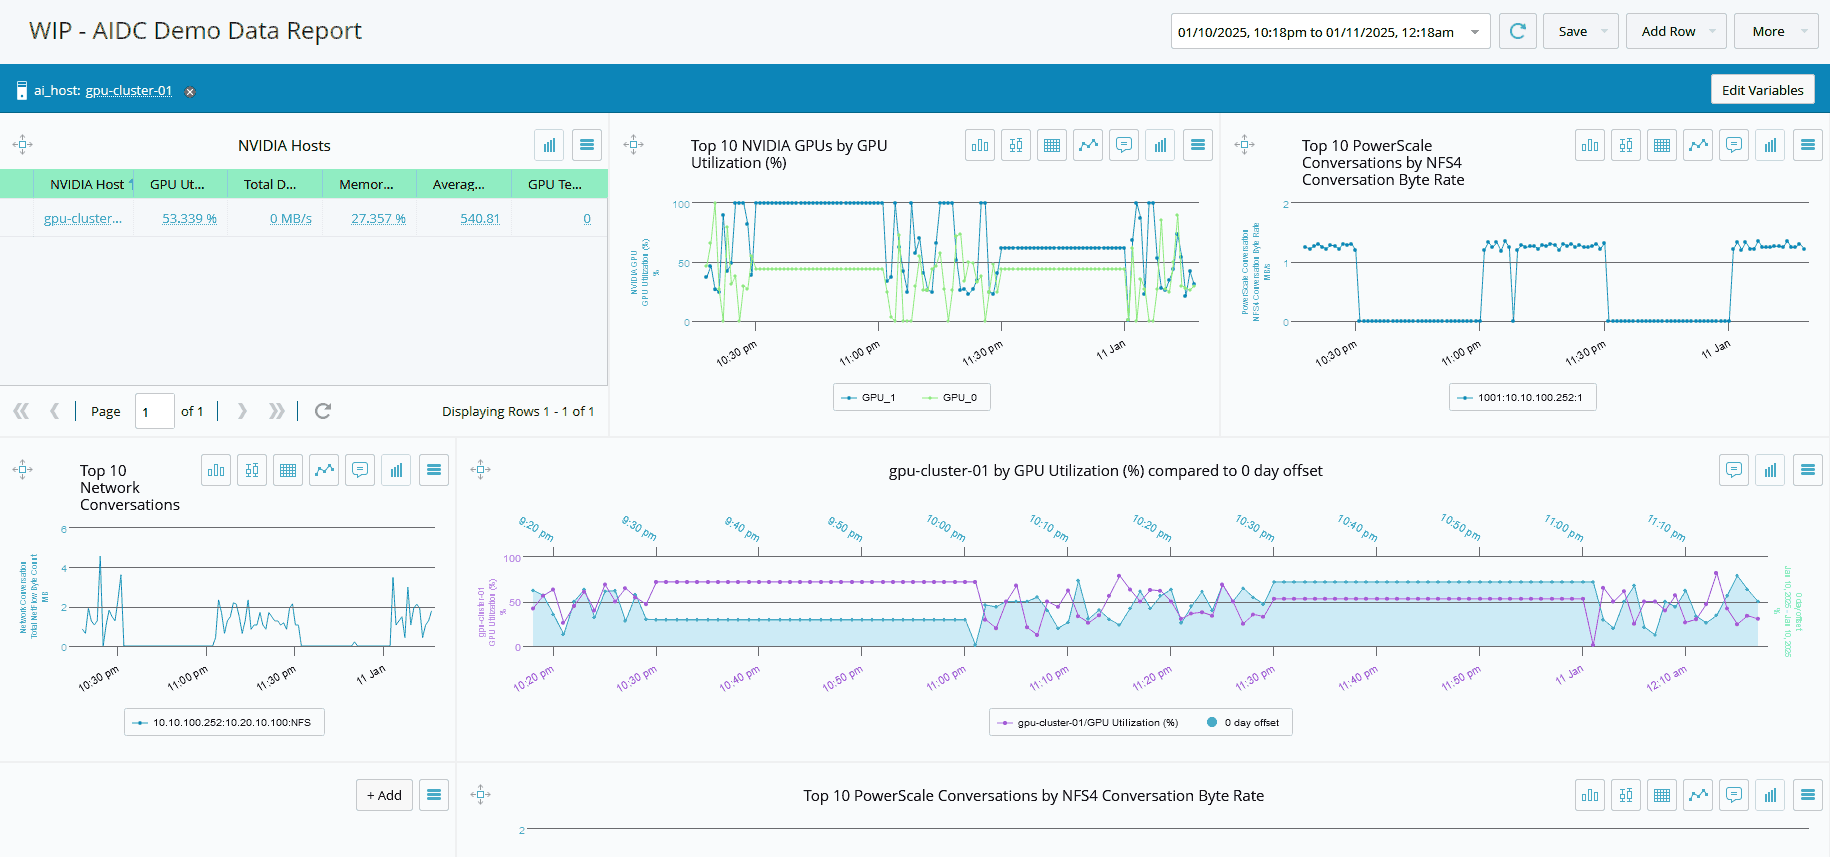
Always-On Metric Collection and Analysis
Continuously monitor critical metrics such as error rates, communication patterns, and congestion points. Gain near real-time insights into infrastructure health and workload performance.
- Identify and resolve bottlenecks before they impact workloads.
- Gain a detailed understanding of resource utilization and efficiency.
Proactive Alerts and Analytics
Set customized alerts to detect anomalies or potential service-impacting events in real-time. Use dynamic thresholding and seasonal trend analysis to monitor workload behavior and ensure stability.
- Stay ahead of performance issues with predictive analytics.
- Define and monitor “normal” workload baselines to detect deviations.
Answer Critical Business Questions with Virtana
Virtana empowers you to make informed decisions with answers to key questions such as:
- What components are connected to my AI Data Fabric, and where?
- Is my infrastructure healthy, and where are potential areas of concern?
- Which workloads are running, and how are they performing?
- How can I optimize workloads across my AI Data Fabric?
- What are the power and cooling requirements for scaling my GPU infrastructure?
Why Virtana Platform
Virtana’s unique combination of industry-standard protocols and proprietary monitoring technology ensures deep visibility and actionable insights for your AI Data Fabric. With Virtana, you can:
- Reduce downtime with proactive monitoring and anomaly detection.
- Optimize workload placement to maximize performance and efficiency.
- Accelerate issue resolution with automated mapping and granular metrics.
- Plan for future growth with long-term trend analysis and capacity planning.