Optimize Your NVMe Storage Environment with Virtana Platform
Harness the Power of Low-Latency, High-Performance NVMe with Comprehensive Observability

95% Reduce MTTR
End-to-end view of what’s connected to your fabric, where it is, and the paths they take across your fabric, and the conditions that are impacting whatever is running on the fabric.

30% improved resource utilization
Optimize resources and gain significant cost savings on infrastructure and better performance without unnecessary over-provisioning.

40% increased operational efficiency
Allow your IT staff to focus on higher-value tasks and strategic initiatives rather than reactive troubleshooting.
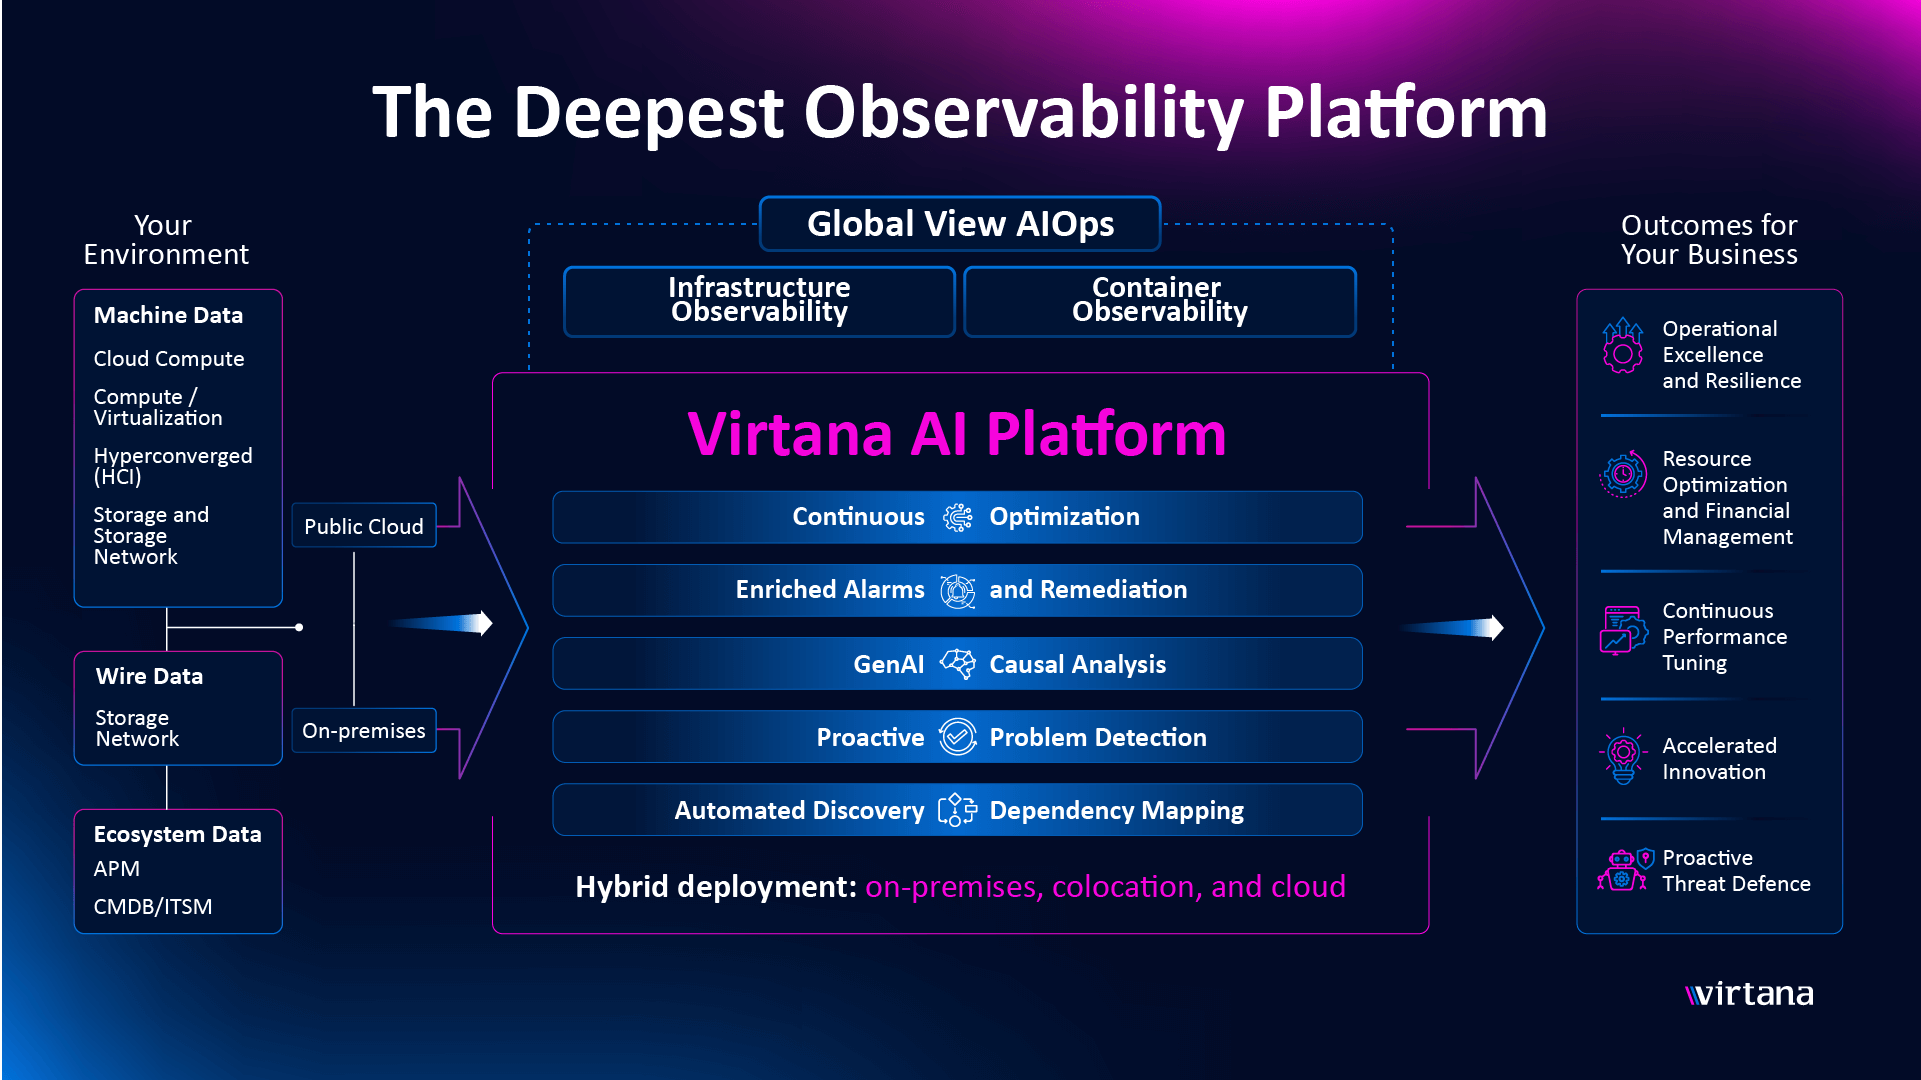
Comprehensive Observability for NVMe Fabrics
Virtana’s Infrastructure Observability modules automatically discover and map every touchpoint of your NVMe fabric, from initiator ports to target ports. Gain actionable insights with:
- Real-time topology mapping: Instantly visualize connections across your NVMe fabric and pinpoint impacted devices.
- Proactive health monitoring: Detect and resolve error-prone links before they escalate into service-impacting events.
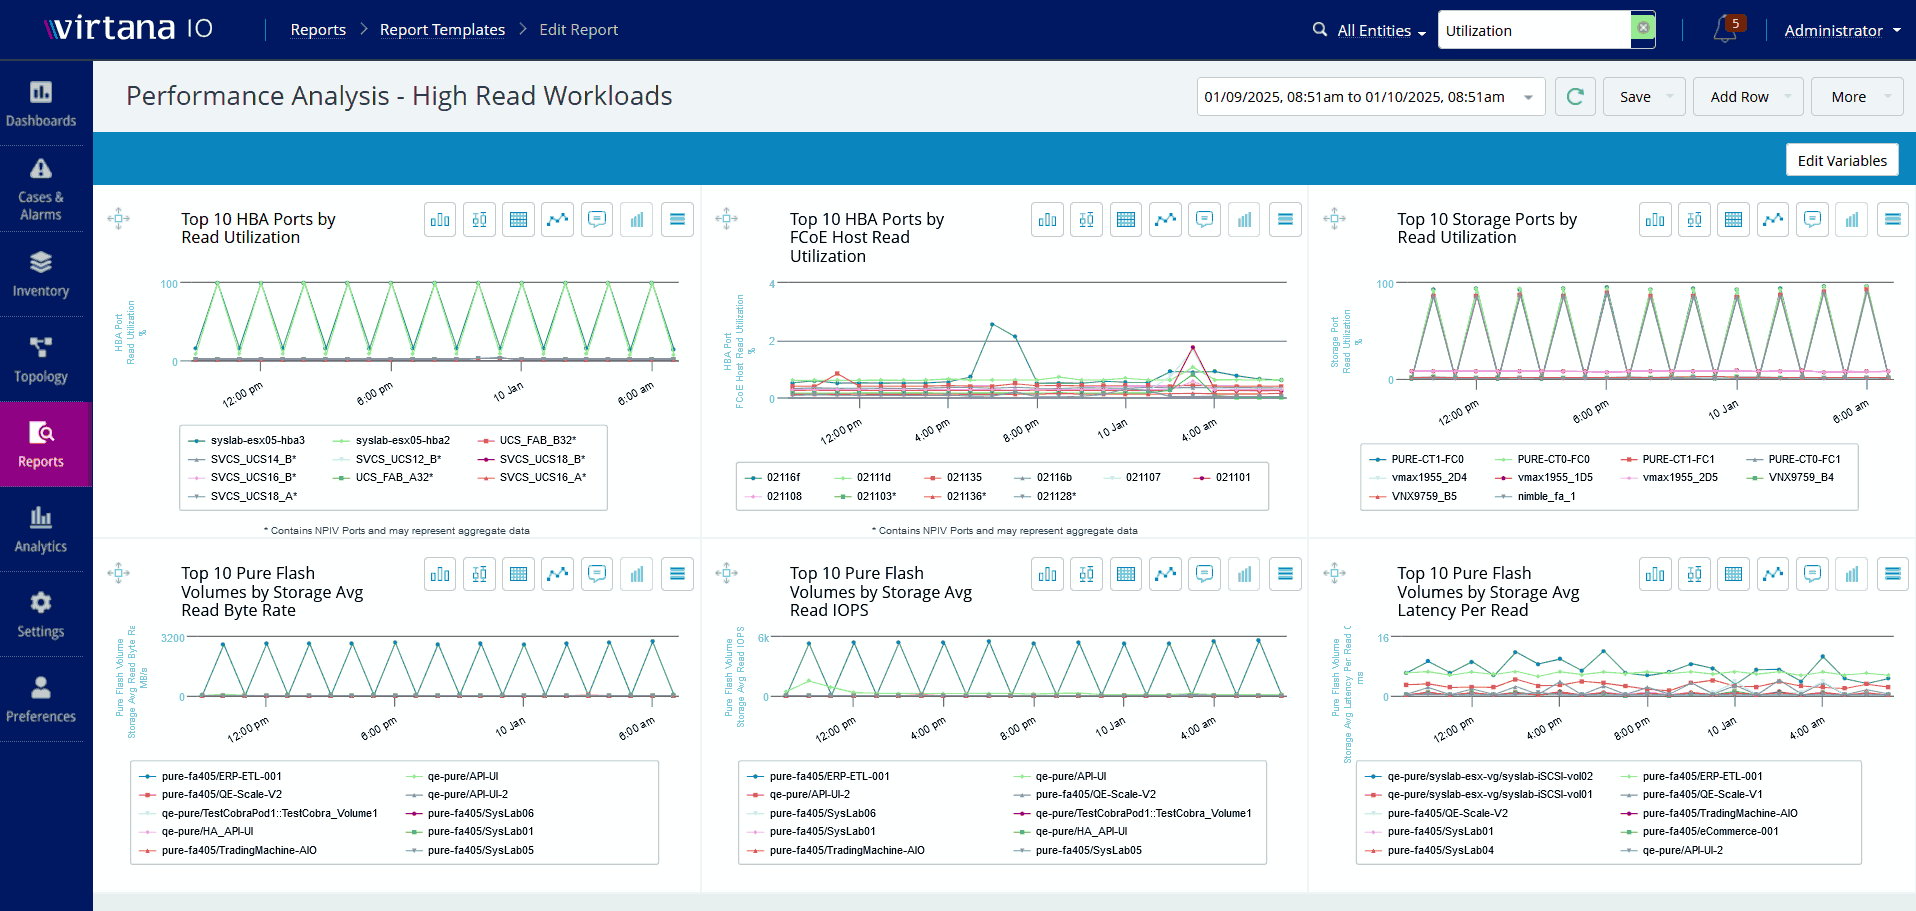
- Granular performance analytics: Identify top talkers, assess communication patterns, and uncover congestion in near real-time.
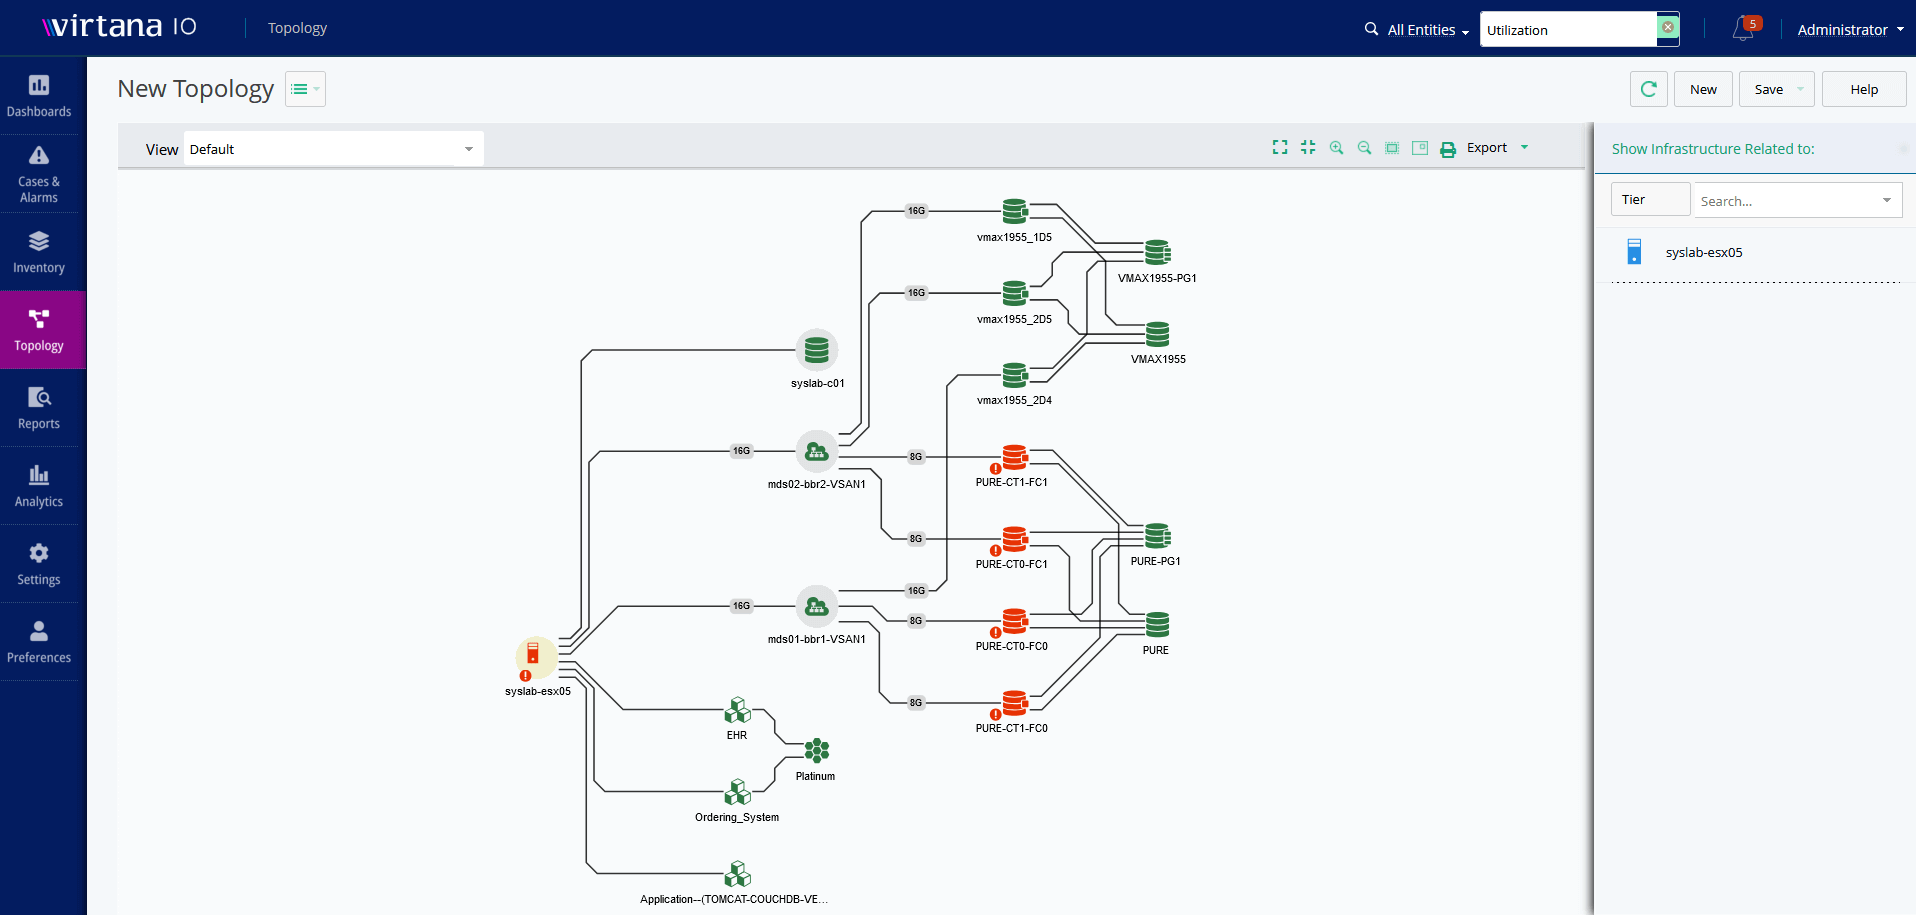
Accelerate Issue Resolution with Real-Time Topology Mapping
Quickly identify “who is talking to whom” across your NVMe fabric with automated connectivity mapping. Filter views to focus on specific devices, enabling faster troubleshooting and improved mean time to resolution (MTTR).
- Automated device discovery
- Streamlined problem identification
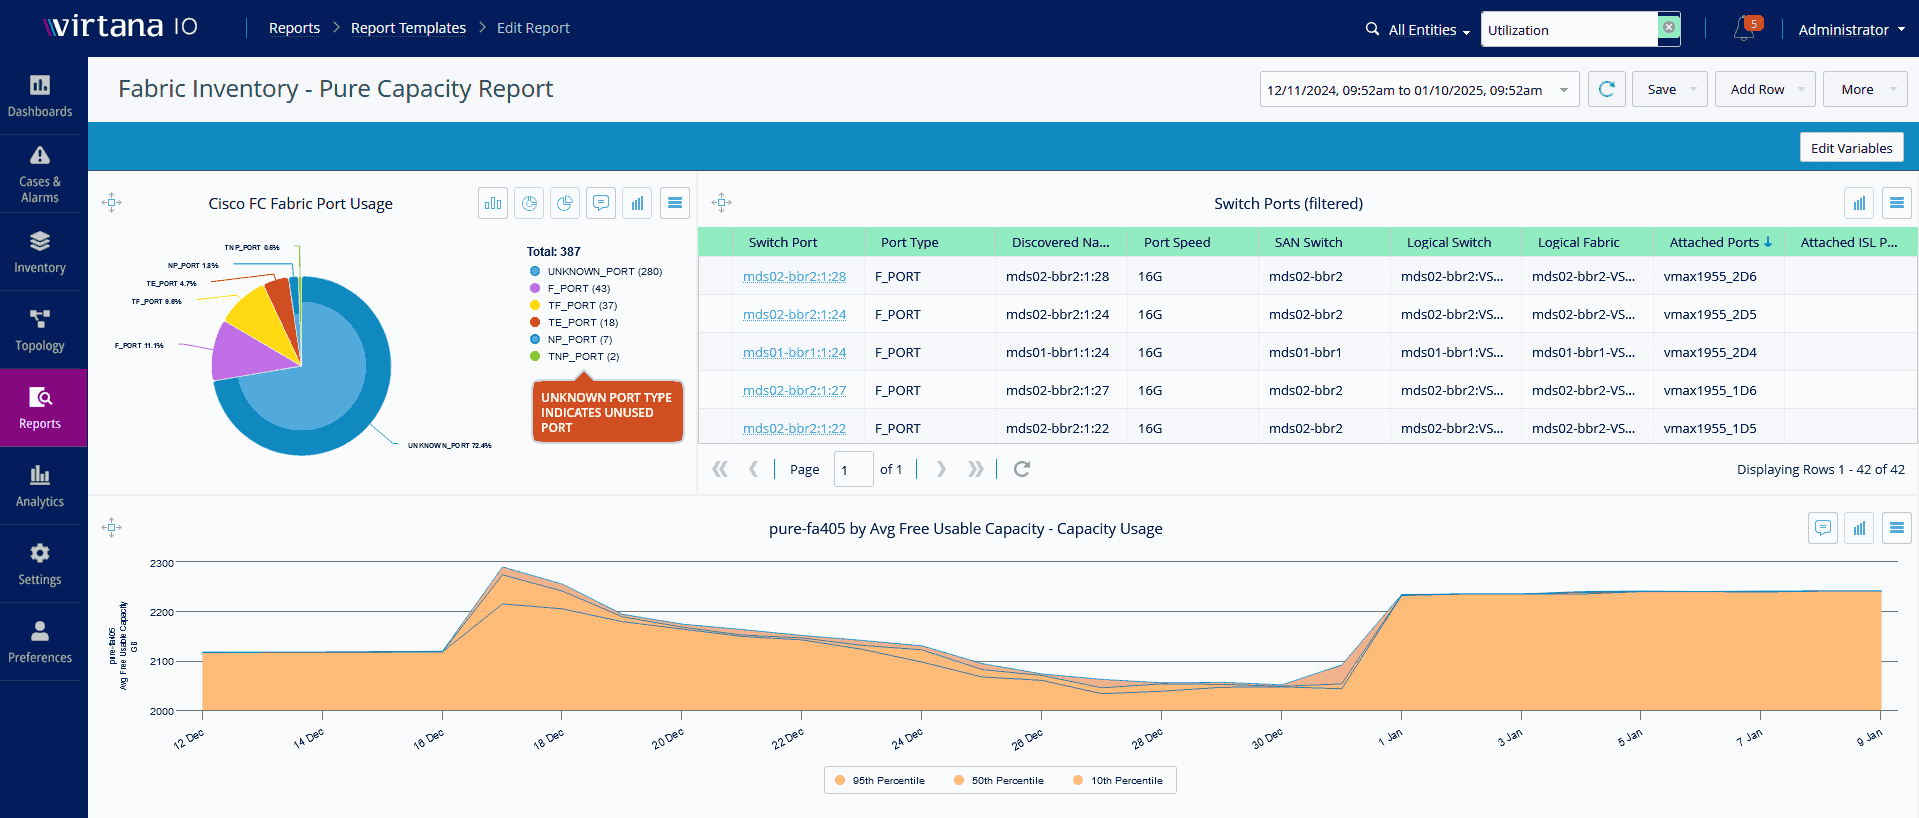
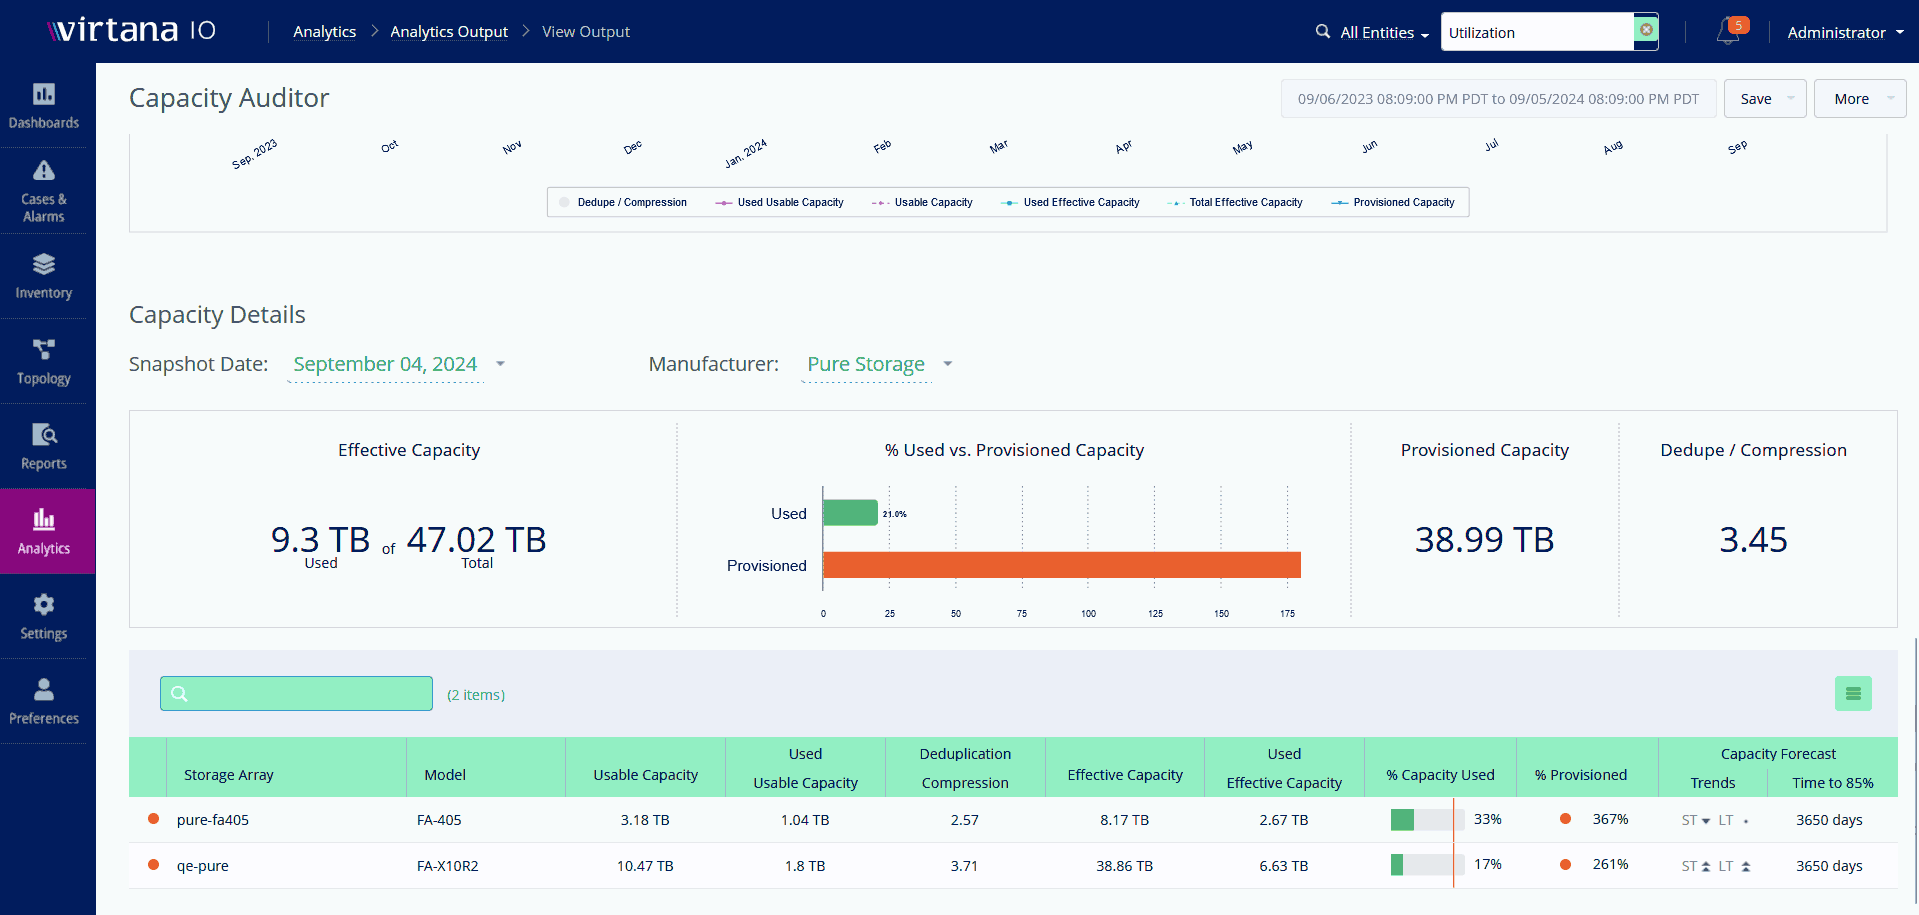
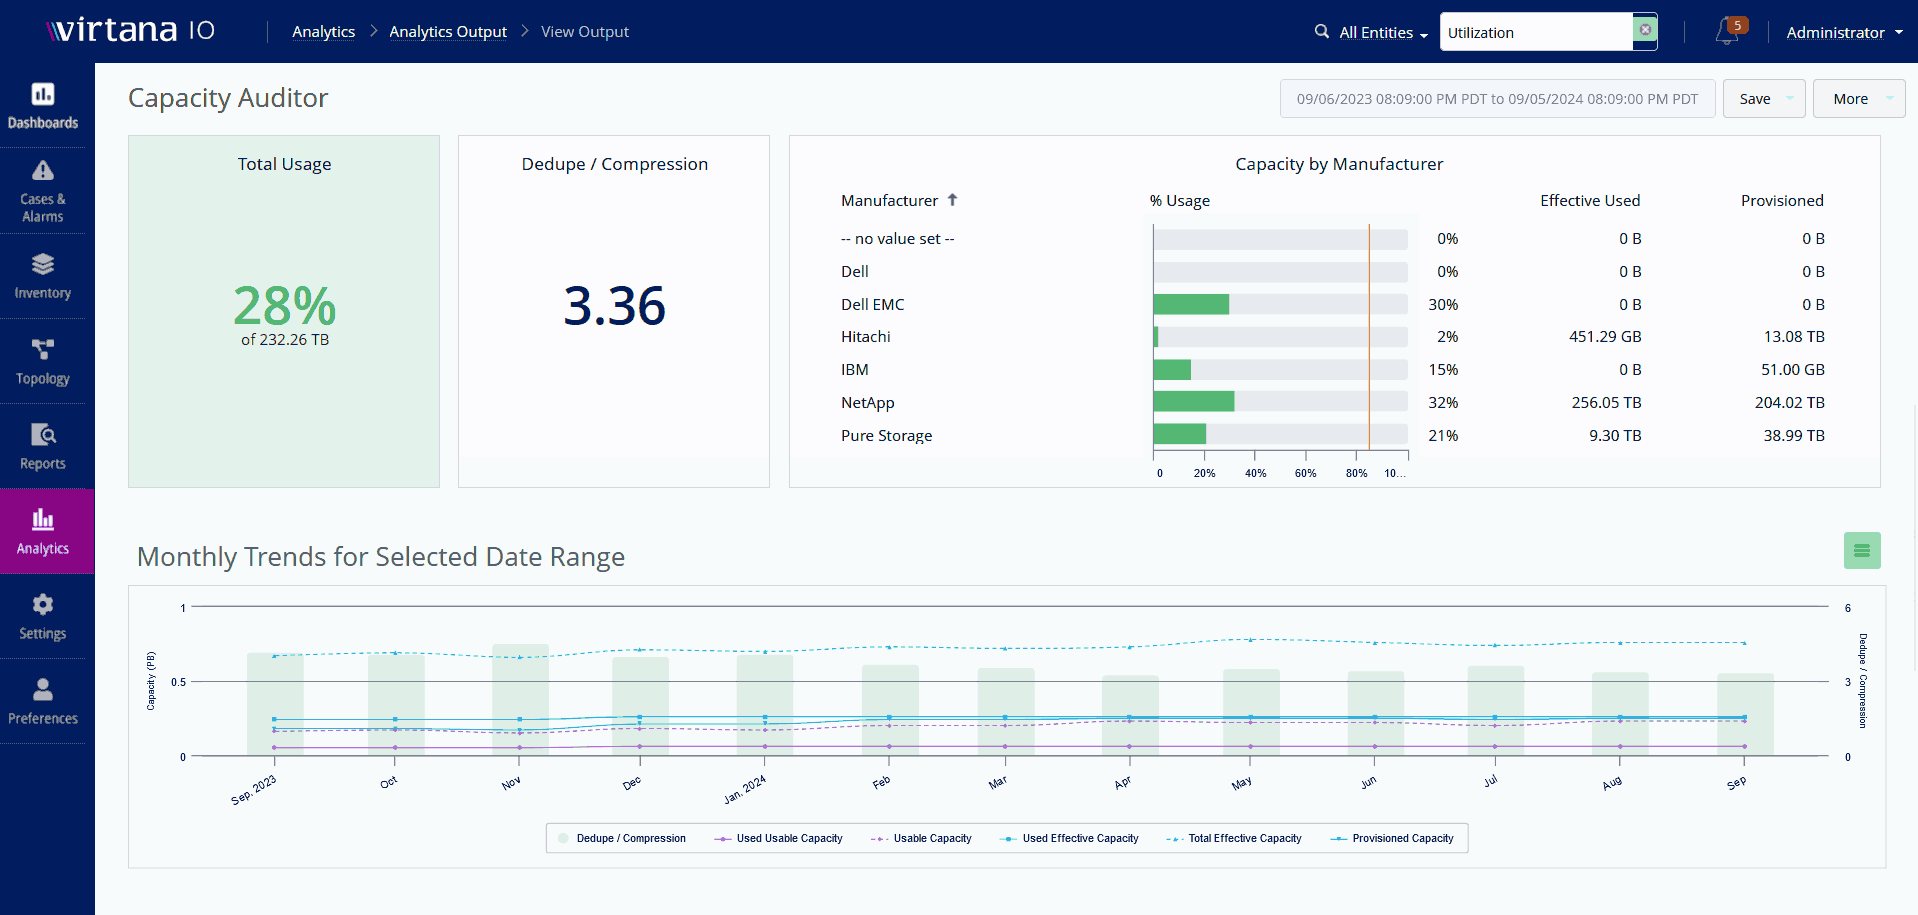
Gain Deep Insights with Always-On Metric Collection
Monitor error rates, communication patterns, and link health in near real-time. Always-on data collection ensures your infrastructure remains optimized and issues are addressed proactively.
- Comprehensive capacity and inventory views
- Smarter workload management and planning
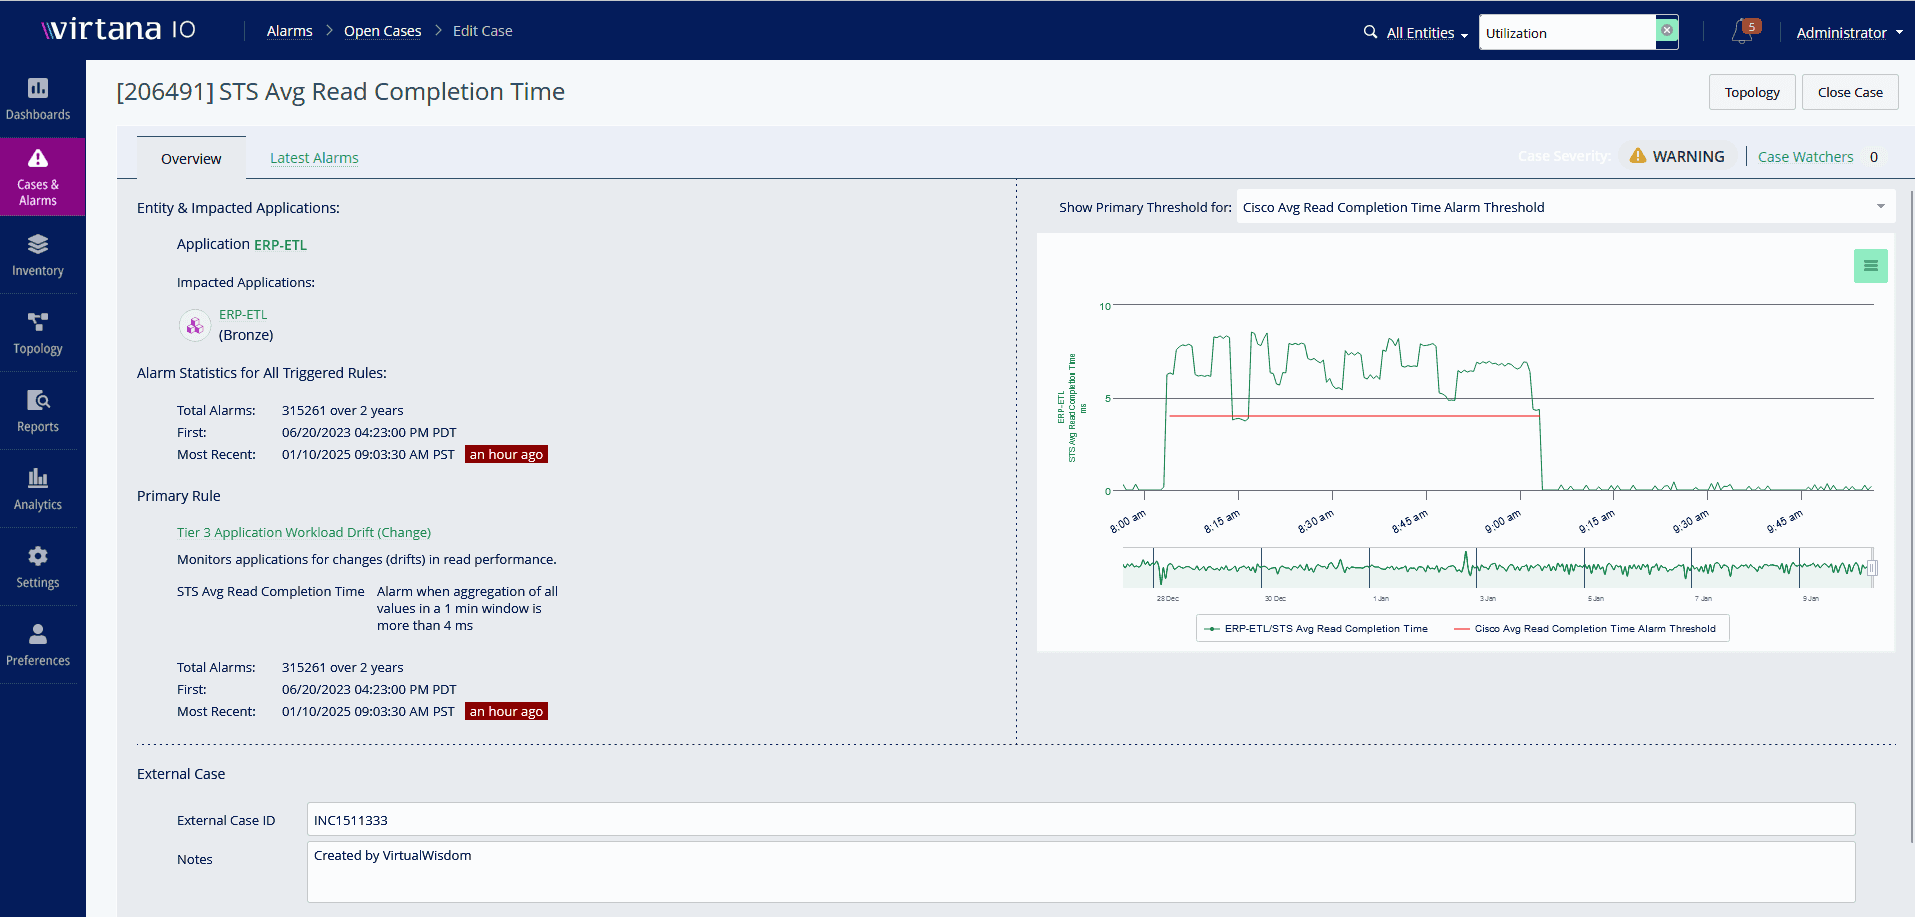
Detect Anomalies Before They Impact Services
Leverage near real-time, highly granular data collection to identify and remediate anomalous events before they disrupt operations. Ensure consistent performance across your NVMe fabric.
- Avoid costly downtime with proactive monitoring
- Stay ahead of service-impacting events
Customize Alerts for Proactive Notifications
Set custom alert rules to detect and respond to anomalies or capacity thresholds. Notifications integrate seamlessly with platforms like Slack, Teams, and ServiceNow for efficient response workflows.
- Proactive anomaly detection
- Seamless ITSM integrations
Supported Environments
Virtana’s Data Fabric Observability supports a broad range of infrastructure components, ensuring comprehensive coverage for NVMe environments:
Fibre Channel-attached storage arrays
- Fibre Channel-attached hosts
- Brocade and Cisco Fibre Channel switches
- Storage virtualizers (e.g., VPLEX, SVC)
- FCoE switching elements and attached hosts
Why Choose Virtana Platform
Virtana combines industry-standard protocols with innovative monitoring technology to deliver unparalleled visibility and control over your NVMe infrastructure. With Virtana, you can:
- Reduce risks by addressing issues before they impact operations.
- Optimize performance to unlock the full potential of your storage investment.
- Streamline troubleshooting for faster, data-driven resolutions.
- Future-proof your environment with predictive analytics and scalable solutions.